

Getting Graphy with Grafana
Who doesn't love a good dashboard?


Introduction
Very early into my IT career, I stumbled upon a tool I immediately wanted to learn, but couldn’t get around the barrier to entry. This tool was Grafana. If you haven’t heard of Grafana, Grafana is a platform for creating super customizable dashboards with complex graphs of metrics from your systems. Below is an example vSphere dashboard.

If you’ve ever browser the subreddit r/grafana, you know this tool is super powerful and ridiculously cool. Originally, I found the idea of learning Grafana overwhelming and in all honesty, I didn’t even know how it worked. Now that I’ve looked at it with fresh eyes, I realized that getting started with Grafana isn’t as complicated as it seems. In this article, I’ll walk you through the basics of Grafana and lead you the direction to making your first dashboard, using docker containers.
Components of a Grafana Dashboard
There are three main components that go into setting Grafana up.
Data Creator - This is whatever you are wanting to monitor and have a dashboard for and the data you want to visualize. (for example, could be a hypervisor to monitor VM resources, could be a NAS that you want to keep an eye on storage, or even something as simple as a website that you want to monitor it’s availability)
Data Source - This is the middle man between grafana and the data creator. It holds the data from your data creator and allows grafana to read it, so you can create graphs for it. There are two different types of data sources, ones that pull data from your data creator, and ones that are set to listen for data sent by your data creator. (There’s a lot of different ones, but the most common ones I see are Prometheus, InfluxDB, Loki, etc.)
Agent (sometimes needed but not always) - Depending on the type of dashboard you wish to create, you may have to also install some form of agent on the data creator. For example, with InfluxDB the common one is telegraf. For our Prometheus example, we will be using Blackbox Exporter.
Grafana - Last piece of the puzzle is grafana itself. You can host grafana multiple different ways. In this article, we’re going to self host it using the OSS edition, but Grafana also offers to host your dashboard if you’re willing to pay for Grafana cloud, and you can even create one in azure as a managed resource! In Grafana, you configure the connection to your data source and then can use the metrics from it to create the dashboards.

How do I know which Data Source to use?
This depends completely on your data creator. To get started, I would recommend searching through the community dashboards to see if anyone else has already made a dashboard for what you’re trying to visualize. This is also a great place for getting some graphy inspiration.

Once you find a dashboard you want to use, you’ll see that the data source used is listed above the dashboard name. For this article, we’re going to build a website status page using the dashboard below, and Prometheus.

Setting up our containers (docker)
The first thing we’re going to need to do is set up docker. If you haven’t used docker before, you can refer to our getting started guide available here, or if you’re installing ubuntu server from scratch, docker is one of the optional software packages you can include during the installation. For this project, I’m installing docker on an ubuntu server box hosted on my homelab’s ProxMox cluster.
Grafana Container
Once you have docker installed, let’s go ahead and start with installing Grafana.
First, let’s create a directory called grafana using the following command.
mkdir grafanaOnce we have a folder created, go ahead and enter it. Once we get in, we’re going to create the file docker-compose.yml using nano and another folder called data.
cd grafana
mkdir data
nano docker-compose.yml
For the content of the file, paste in the information below.
version: '3.8'
services:
  grafana:
    image: grafana/grafana:latest
    container_name: Grafana
    ports:
      - 3000:3000
    volumes:
      - /home/user/grafana/data:/var/lib/grafana
    user: "1000:1000"
    environment:
      - GF_SECURITY_ADMIN_PASSWORD=admin
    restart: always
NOTE: you need to change the word user with your user account’s name. Also, don’t worry, that admin password is going to change.
Once you’ve done that, run the following command to change the permissions on our data folder (again, be sure to change user to your username).
sudo chown -R 1000:1000 /home/user/grafana/dataOnce you have that file, run the following command to spin up the container.
sudo docker compose up -dTo verify everything is working, let’s try to see if we can get to the grafana web interface. To do this, you’ll need to find the IP address of your machine (the command ip a will give you this information). Once you have it, go to your web browser and put this in the address bar (replacing the x’s with your IP address).
http://x.x.x.x:3000If you see this pretty sign in screen, you’re golden. Type in admin for both the username and password to login, and you’ll automatically be prompted to create a new password.
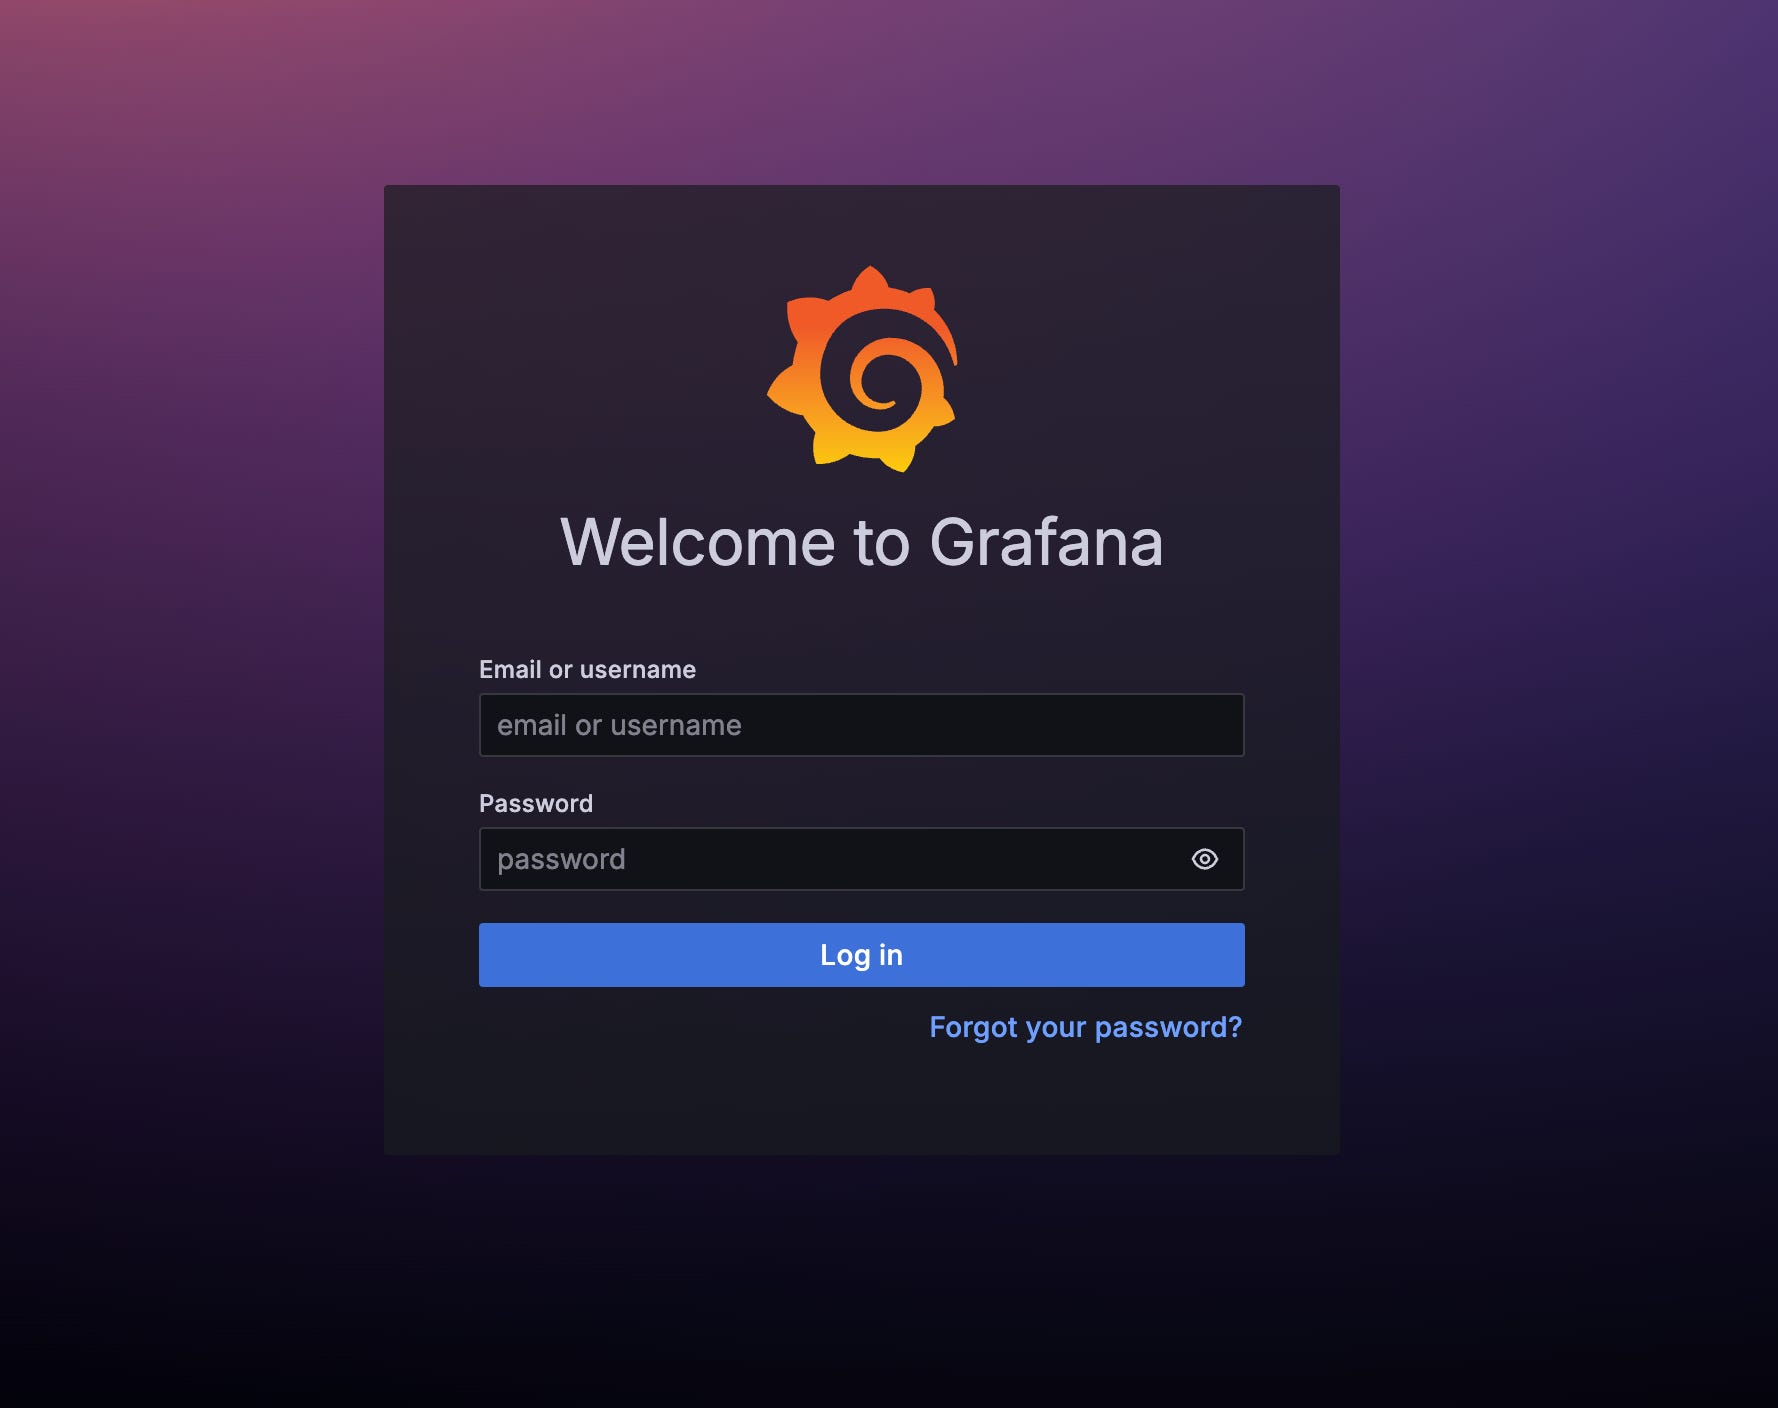
After this, we are now have Grafana up and running! Now time to install a data source.
Datasource container (prometheus in this example)
As mentioned, your data source depends mostly on what you’re trying to visualize. We’re going to use Prometheus in this example.
First, let’s go ahead and make a directory for our yaml files like we did with Grafana. Make sure you’re back at your home directory before creating the folder.
mkdir prometheus
cd prometheus
nano docker-compose.yml
Paste the following information in your docker compose file. Note that we’re also including blackbox in this docker compose file, as we will be using this to probe our websites.
version: "3.8"

services:
  prometheus:
    image: prom/prometheus:latest
    container_name: prometheus
    ports:
      - "9090:9090"
    volumes:
      - ./prometheus.yml:/etc/prometheus/prometheus.yml:ro
      - prometheus_data:/prometheus
    restart: always

  blackbox:
    image: prom/blackbox-exporter:latest
    container_name: blackbox
    ports:
      - "9115:9115"
    volumes:
      - ./blackbox.yml:/etc/blackbox_exporter/config.yml
    command:
      - '--config.file=/etc/blackbox_exporter/config.yml'
    restart: always

volumes:
  prometheus_data:
Next, we’re going to make another yaml file with some configuration for prometheus.
nano prometheus.ymlPaste the following into this file. Be sure to add in your own targets to query.
scrape_configs:
  - job_name: 'prometheus'
    static_configs:
      - targets: ['localhost:9090']

  - job_name: 'blackbox'
    metrics_path: /probe
    params:
      module: [http_2xx]
    static_configs:
      - targets:
          - https://www.edtechirl.com
          - http://notanowneddomain.com
    relabel_configs:
      - source_labels: [__address__]
        target_label: __param_target
      - source_labels: [__param_target]
        target_label: instance
      - target_label: __address__
        replacement: blackbox:9115
Next, we have to create a configuration file for blackbox.
nano blackbox.ymlPaste the following information.
modules:
  http_2xx:
    prober: http
    timeout: 10s
    http:
      method: GET
      valid_status_codes: []
      fail_if_ssl: false
      fail_if_not_ssl: false
      preferred_ip_protocol: "ip4"
Lastly, run the following command in the prometheus folder to spin up the two containers.
docker compose up -dOnce you’ve done this, you can run sudo docker ps to see all of your running containers. There should be three of them.
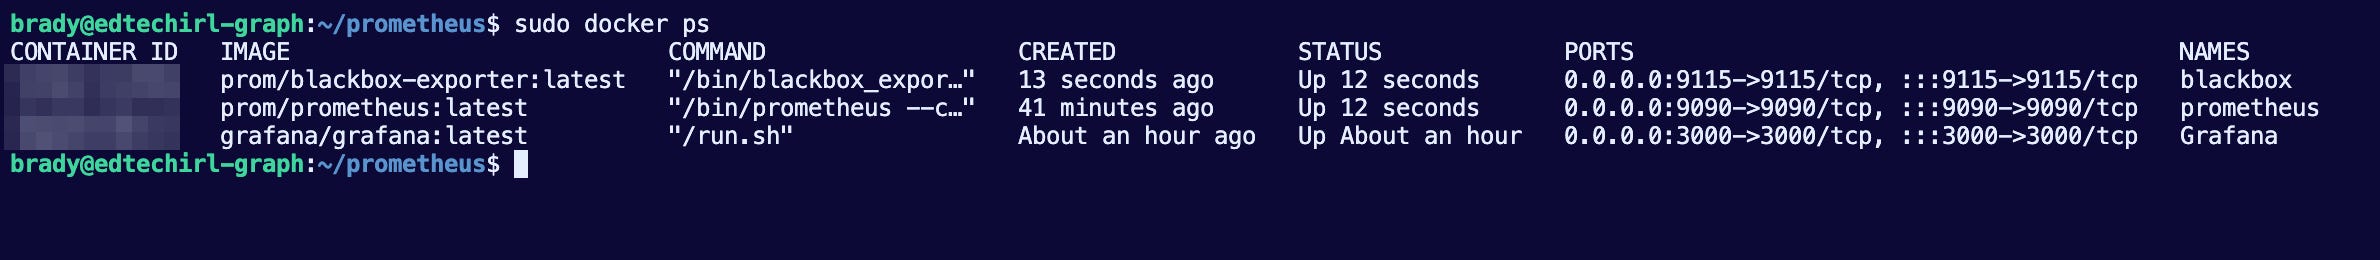
As a last verification before we set up Grafana, make sure that blackbox is sending information to prometheus. To do this, navigate to the prometheus web interface (same IP as our grafana page from earlier, but with the port number 9090).
If you type in the query probe_success and click Execute, you should see our websites we defined popped up below.

Dashboard Time
Let’s navigate back to Grafana. Once you’re there, click on Dashboards from the side panel menu.
Click the Create a Dashboard button, and then choose the option to import a dashboard.
You should be able to type in 13659 into the search bar and click load. Once you do, Grafana will pull up extra information about the dashboard we are importing.
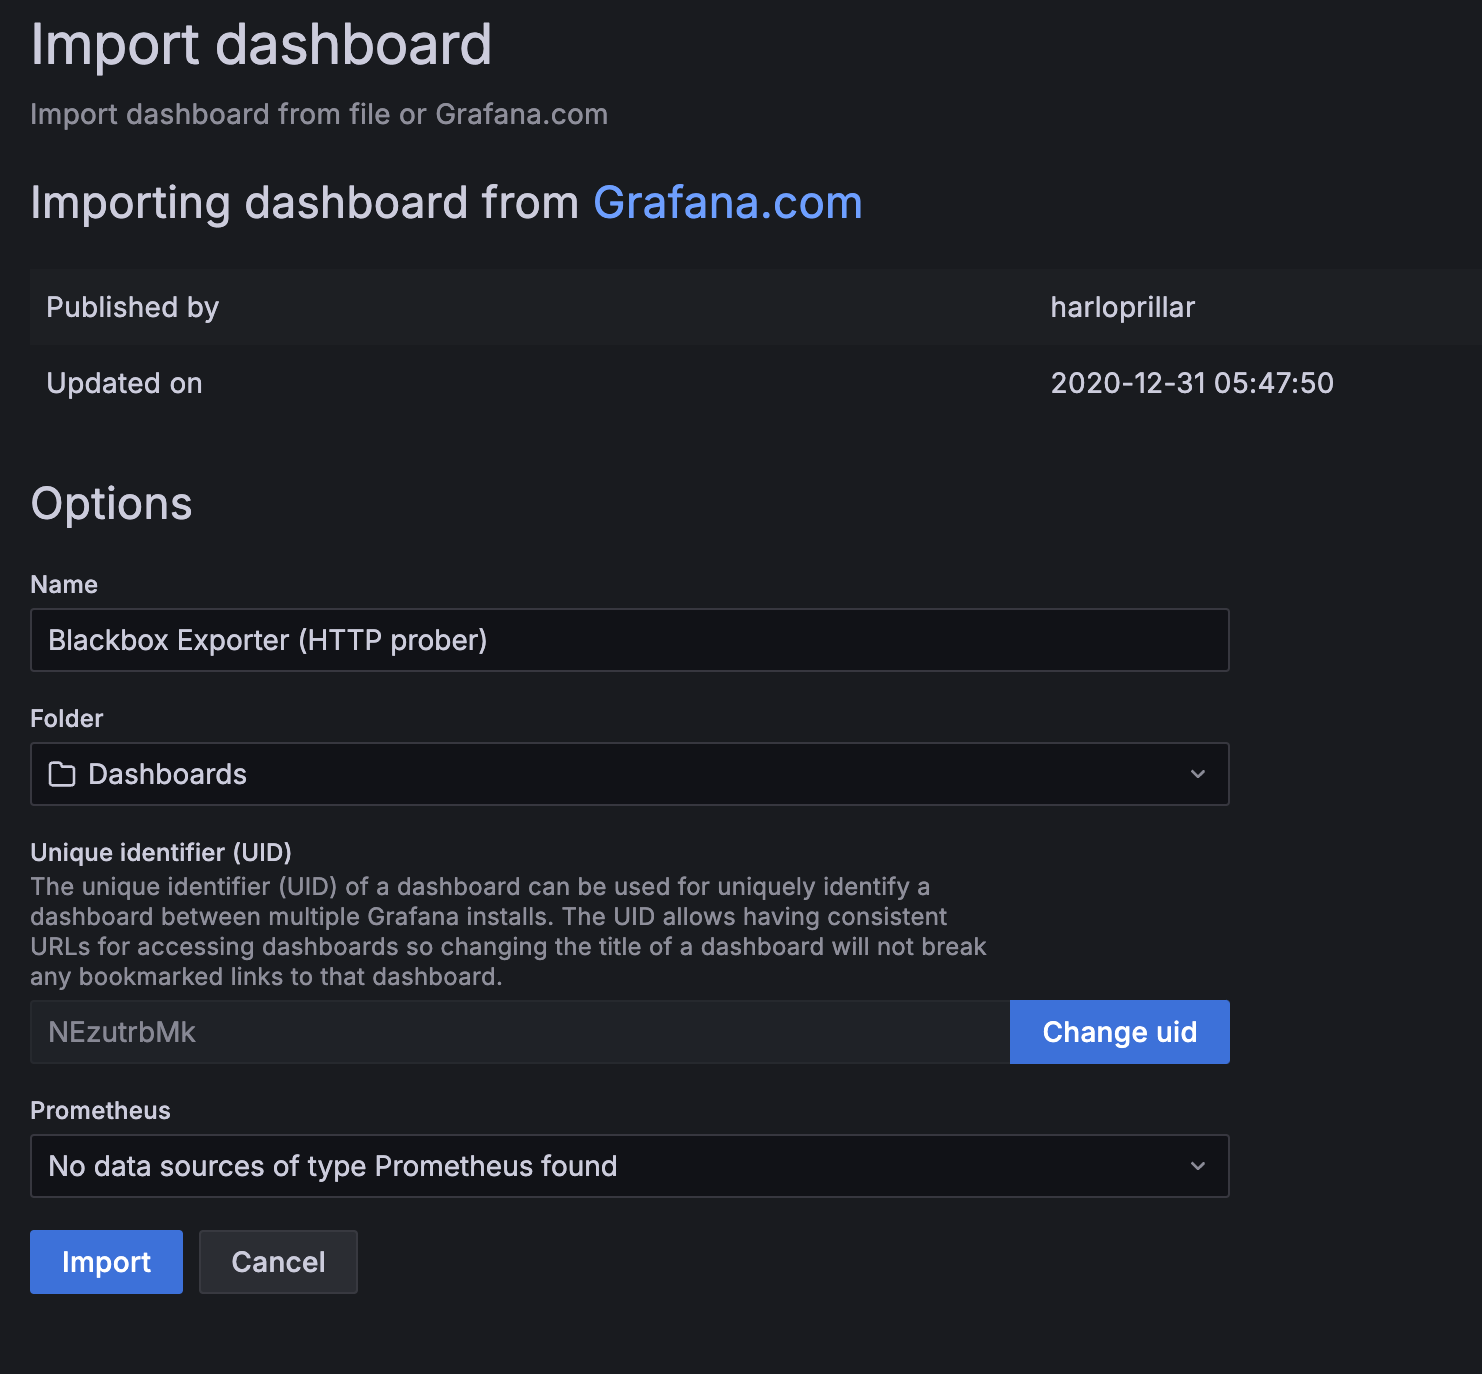
Where it says prometheus at the bottom, click the drop down and then the configure a new data source button.
Here you will see a list of all the data sources. Prometheus should be at the top, so click it. Here you’ll have to configure the data source by giving it a name and pointing it to your IP address (in the picture I put localhost, but this did not work for me until I put in the actual IP). Towards the bottom you will be asked to provide authentication information for your data source. Click no authentication as that is the default for prometheus. For other data sources (such as influxdb) you may need to configure this with your credentials or an API key.

Once you are done, click Save and Test and it will tell you if it was able to make your connection. Once you are done, you can x out of that tab and go back to the tab with our dashboard import. Select the prometheus data source you just created (you may have to refresh the browser for it to come up) and click import.
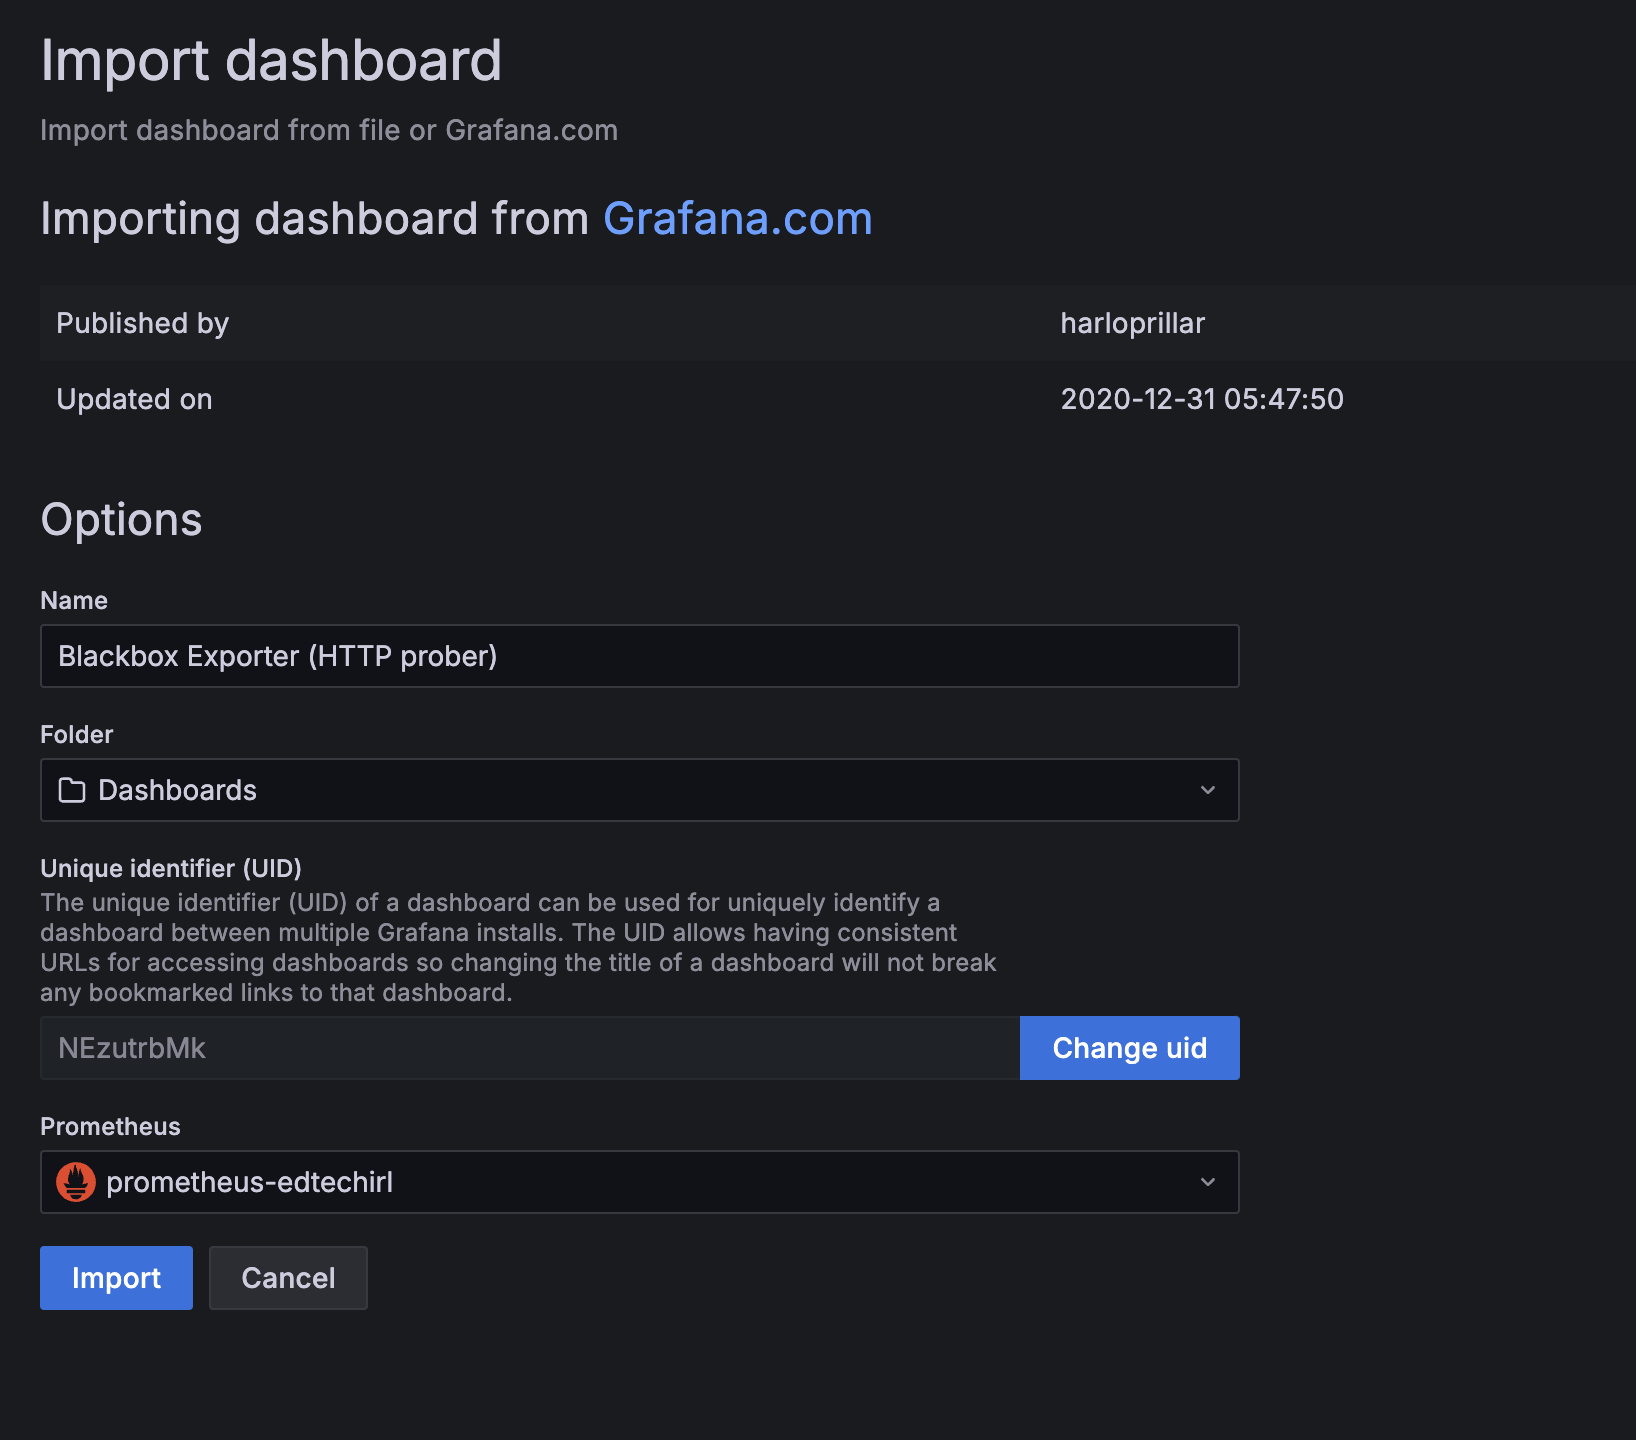
Once you import, and open your dashboard, you should see the data being monitored.

Now with this, you can build a really nice status page for your school or organization’s essential websites and services. If you want to add new sites, you’ll have to edit the prometheus.yml configuration file and kill and rebuild the containers again using the docker compose file we created.
Happy Graphing!